


User Guide
Updated January 2012Using Graphs
Once you have a few entries, you can start using the graphs.
Panning and Zooming
The graph spans the timeframe containing all of your entries.
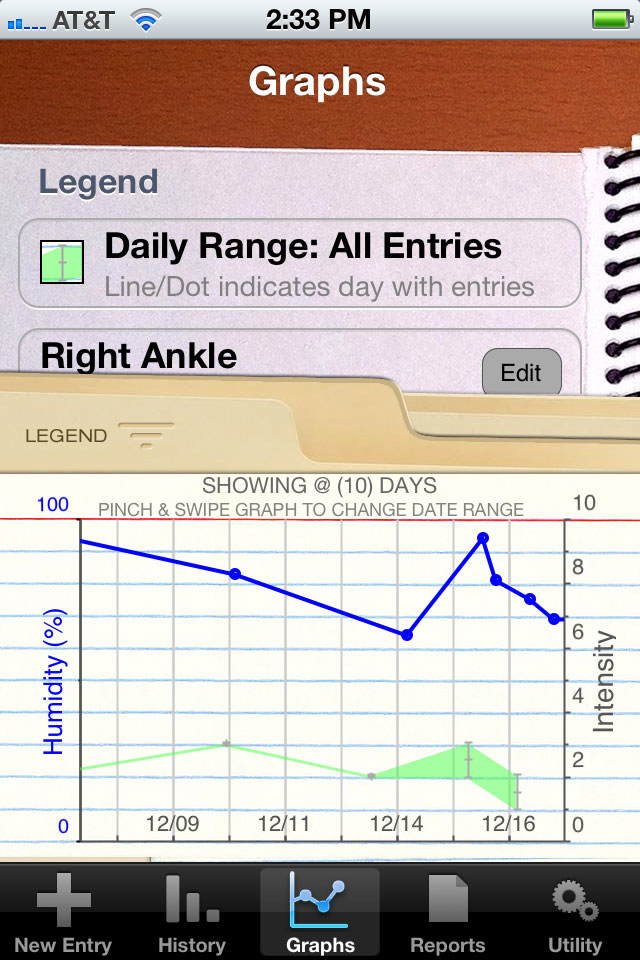
Once you have entries that span more than 10 days, you can pinch or swipe to change the date range shown in the window.
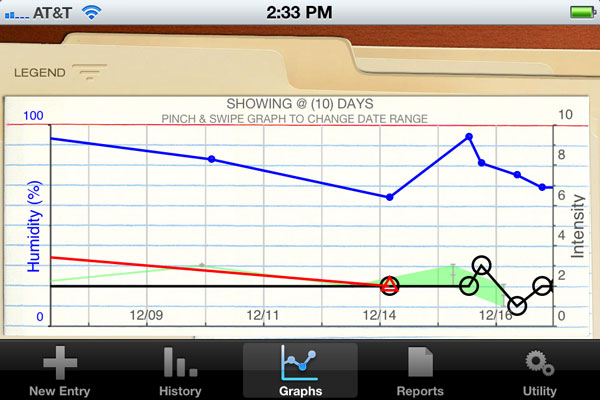
For a better experience, and a bigger graph, rotate your device to Landscape Mode.
Weather Plots
If you have been tracking weather with your entries, you can plot any ONE weather metric on the graph at a time. Just tap the respective weather metric in the legend, and if there is data -- it will plot.
The graph's left axis always displays the weather scales. The right axis always displays the 0-10 intensity scale.
Custom Plots
The graph can show up to three (3) custom plots at a time. Tap the respective [Edit] button to select which metric value to plot.
You can toggle the visibility of these plots by tapping the plot in the legend.
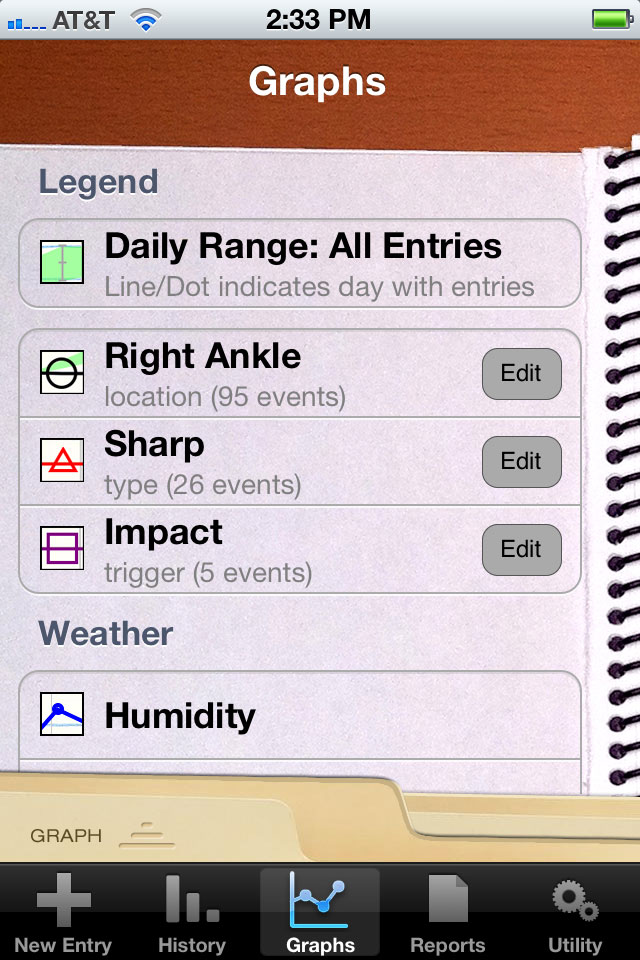
The Legend
The legend for the graph is typically hiding behind the graph. Move the graph to reveal the legend by tapping the Legend/Graph toggle button.